DDNet Server Statistics with ServerStatus, RRDtool and Nim
2016-05-14 · DDNet · Nim · Frugality · ProgrammingAbout a month ago I set up statistics for the official DDNet servers. My motivations for this are:
- Monitor the servers more easily
- Get notified about server problems
- Have nice graphs to look at
The choices for the software used are mainly made to keep resource usage low, a general principle used for DDNet since we run on cheap VPSes all around the world and are limited in CPU and memory resources. In the rest of this post we will explore the 3 major tools used, their purpose in our solution as well as their performance impact:
- ServerStatus: Gather live server statistics
- RRDtool: Record and graph data
- Nim: Favorite programming language for performance and readability
Gathering live server statistics with ServerStatus
We’ve been running BotoX’s ServerStatus to get live server statistics for some time now. It works quite well to quickly notice major server problems like a high load or incoming (D)DoS attacks, provided that you keep an eye out for it.
We use ServerStatus by running its simple Python client on each server to gather interesting information. The client transmits that data by TCP to the C/C++ server, which aggregates it into a JSON file. This JSON file is then fetched and displayed every two seconds by the JavaScript frontend of our Status page.
On a regular Saturday morning the end result looks like this:
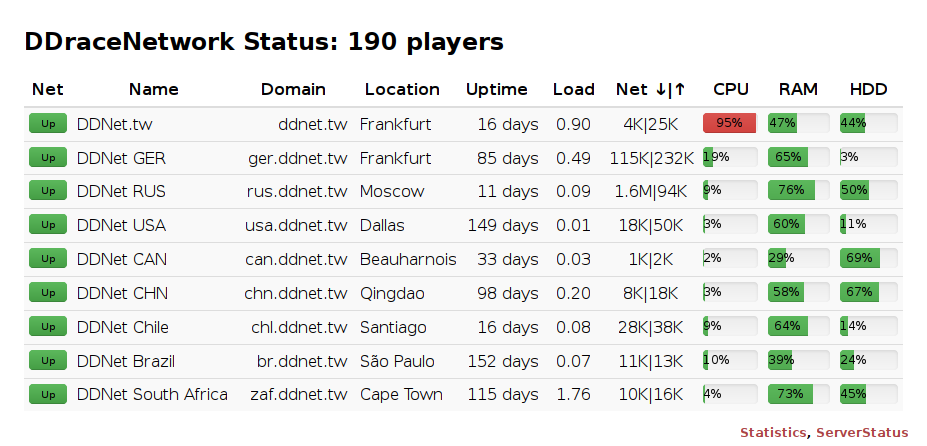
On a quick glance you notice that the DDNet.tw server has high CPU usage (which is totally normal since it runs some hefty cron jobs every 20 minutes) and DDNet RUS is receiving a small DoS attack with just 1.6 MB/s (unfortunately also totally normal). Apart from that everything looks fine.
ServerStatus footprint, calculated from Linux /proc statistics as follows (in Nim):
import os, strutils, posix, strfmt
# CPU and memory usage of process, based on PROC(5) and
# http://stackoverflow.com/a/16736599
let
  pid = paramStr(1)
  # Clock ticks per second
  frequency = sysconf(SC_CLK_TCK)
  # Size of memory page in bytes
  pagesize  = sysconf(SC_PAGESIZE)

  uptime    = readFile("/proc/uptime").split[0].parseFloat
  fields    = readFile("/proc/" & pid & "/stat").split

  # Amount of time in user mode
  utime     = fields[13].parseInt
  # Amount of time in kernel mode
  stime     = fields[14].parseInt
  # Amount of children time in user mode
  cutime    = fields[15].parseInt
  # Amount of children time in kernel mode
  cstime    = fields[16].parseInt
  # Time process started after boot
  starttime = fields[21].parseInt

  # Resident Set Size: number of pages in memory
  rssmem    = fields[23].parseInt

  totaltime = utime + stime + cutime + cstime
  seconds   = uptime - (starttime / frequency)

  cpuusage  = 100 * (totaltime / frequency) / seconds
  memusage  = rssmem * pagesize / 1_000_000

echo interp"${cpuusage:.2f} % CPU ${memusage:.2f} MB Memory"| Part | CPU | Memory |
|---|---|---|
| Client | 0.14 % | 3.70 MB |
| Server (9 clients) | 0.58 % | 0.18 MB |
Recording and graphing data with RRDtool
I haven’t used RRDtool for about 7 years, but it’s still an excellent tool to record data into a fixed-size round robin database. For us three functions of RRDtool are important: create to create the database, update to add a new value to be aggregated into the database, and graph to render the database into a beautiful graph.
CPU, network and memory are the most important resources for me, so their usage should be recorded. Let us use network traffic as an example and create a database:
First we need to think about what data we want to record in the RRD:
1 sample = 30 seconds

 1 day  =   2880 samples =   6 * 480 pixels, each pixel is 03:00 min
 7 days =  20160 samples =  42 * 480 pixels, each pixel is 21:00 min
49 days = 141120 samples = 147 * 960 pixels, each pixel is 73:30 min
Then we can use this to create the actual database file:
rrdtool create ddnet.tw-net.rrd `# File name` \
  --step 30 `# Interval in seconds with which data is fed` \
  DS:network_rx:GAUGE:60:0:U `# Data source receiving` \
  DS:network_tx:GAUGE:60:0:U `# DS Sending` \
  RRA:AVERAGE:0.5:6:480 `# Round robin archive for 1 day` \
  RRA:AVERAGE:0.5:42:480 `# RRA for 7 days` \
  RRA:AVERAGE:0.5:147:960 `# RRA for 49 days`
If you’re curious about what exactly happens here, you can find more information in rrdcreate(1).
The resulting ddnet.tw-net.rrd file is just 32 KB in size and will forever stay that exact size. (All our databases together are just 1 MB.) New data in each round robin archive simply overwrites the oldest data. A disadvantage of RRDtool is that you need to think ahead and plan what data you want to store.
The next step is to put new data into our little database, which we should do every 30 seconds:
rrdtool update ddnet.tw-net.rrd N:42:1234Super simple! 42 is our network_rx value, 1234 the value for network_tx. These values are now aggregated using the AVERAGE and finally put into their respective archives.
Once we have enough values we can finally create the graph, for example for 1 day:
rrdtool graph ddnet.tw-net-1d.png --rigid --base 1000 \
  --width 419 --height 150 --logarithmic --units=si -a PNG \
  `# Calculation over last day only` \
  --vertical-label "Bytes/s" --start now-1d \
  `# Fetch data from RRD file` \
  DEF:network_rx=ddnet.tw-net.rrd:network_rx:AVERAGE \
  DEF:network_tx=ddnet.tw-net.rrd:network_tx:AVERAGE \
  `# Calculate aggregates based on data` \
  VDEF:network_rx_a=network_rx,AVERAGE \
  VDEF:network_rx_m=network_rx,MAXIMUM \
  VDEF:network_rx_c=network_rx,LAST \
  VDEF:network_rx_s=network_rx,TOTAL \
  VDEF:network_tx_a=network_tx,AVERAGE \
  VDEF:network_tx_m=network_tx,MAXIMUM \
  VDEF:network_tx_c=network_tx,LAST \
  VDEF:network_tx_s=network_tx,TOTAL \
  `# Draw area graph in light colors` \
  AREA:network_tx#fee8c8: \
  AREA:network_rx#e0e0e0: \
  `# Draw clear area outline on top` \
  LINE1:network_tx#e34a33:"out" \
  `# Print aggregate values to legend` \
  GPRINT:network_tx_a:"avg\: %6.2lf %sB" \
  GPRINT:network_tx_m:"max\: %6.2lf %sB" \
  GPRINT:network_tx_c:"cur\: %6.2lf %sB" \
  GPRINT:network_tx_s:"sum\: %6.2lf %sB\n" \
  `# Other area outline` \
  LINE1:network_rx#636363:"in " \
  GPRINT:network_rx_a:"avg\: %6.2lf %sB" \
  GPRINT:network_rx_m:"max\: %6.2lf %sB" \
  GPRINT:network_rx_c:"cur\: %6.2lf %sB" \
  GPRINT:network_rx_s:"sum\: %6.2lf %sB\n"
As always, the manual of rrdgraph explains the possibilities.
I’m using RRDtool 1.6.0 instead of 1.4.8 because I very much prefer its density of x-axis labels. Here are the outputs of our database:
RRDtool 1.4.8: 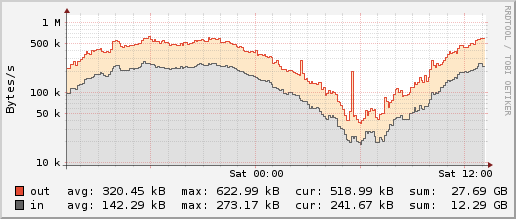 RRDtool 1.6.0:
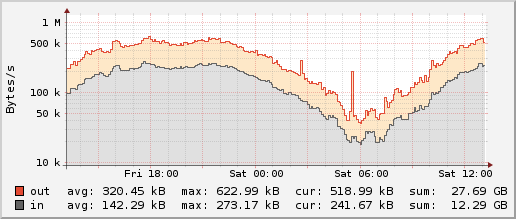
RRDtool footprint:
| Part | Runtime | Memory |
|---|---|---|
| Create (9 servers) | 0.01 s | 1.74 MB |
| Graph (9 servers) | 1.99 s | 2.82 MB |
Putting it together with Nim
To aggregate the raw data from ServerStatus into 30-second packets I use a small Nim program. It automatically creates new databases when a new server is added and keeps them updated:
import common, json, osproc, os, times, strutils, tables

type
  Data = object
    network_rx, network_tx: BiggestInt
    cpu, memory_used, memory_total, swap_used, swap_total: BiggestInt
    load: float

const freq = 30 # report new data to rrd every 30 seconds

var
  lastUpdated: BiggestInt = 0
  dataTable = initTable[string, Data]()
  count = 0
  countTable = initTable[string, int]()

proc rrdCreate(file, dataSources: string) =
  discard execCmd(rrdtool & " create " & file & " --step " & $freq & " " & dataSources &
    " RRA:AVERAGE:0.5:6:480 RRA:AVERAGE:0.5:42:480 RRA:AVERAGE:0.5:147:960")

proc rrdUpdate(file: string, values: varargs[string, `$`]) =
  var valuesString = ""
  for value in values:
    if valuesString.len > 0:
      valuesString.add ":"
    valuesString.add value
  discard execCmd(rrdtool & " update " & file & " N:" & valuesString)

proc updateServer(server: JsonNode) =
  let domain = server["type"].str

  for name, value in dataTable.mgetOrPut(domain, Data()).fieldPairs:
    when value is BiggestInt:
      value += server[name].num
    elif value is float:
      value += server[name].fnum
    else:
      error "Unhandled type in Data object"

  inc countTable.mgetOrPut(domain, 0)

  # Only save data if we got 30 values in the expected time span
  if count == freq and countTable[domain] == freq:
    let data = dataTable[domain]
    if data == Data():
      dataTable.del(domain)
      return
    else:
      dataTable[domain] = Data()

    let
      fileNet = (rrdDir / domain) & "-net.rrd"
      fileCpu = (rrdDir / domain) & "-cpu.rrd"
      fileMem = (rrdDir / domain) & "-mem.rrd"

    if not existsFile fileNet:
      fileNet.rrdCreate("DS:network_rx:GAUGE:60:0:U DS:network_tx:GAUGE:60:0:U")
    if not existsFile fileCpu:
      fileCpu.rrdCreate("DS:cpu:GAUGE:60:0:100 DS:load:GAUGE:60:0:U")
    if not existsFile fileMem:
      filemem.rrdCreate("DS:memory_used:GAUGE:60:0:U DS:memory_total:GAUGE:60:0:U DS:swap_used:GAUGE:60:0:U DS:swap_total:GAUGE:60:0:U")

    fileNet.rrdUpdate(data.network_rx div freq, data.network_tx div freq)
    fileCpu.rrdUpdate(min(data.cpu div freq, 100), data.load / freq)
    fileMem.rrdUpdate(data.memory_used div freq, data.memory_total div freq, data.swap_used div freq, data.swap_total div freq)

proc updateAllServers =
  let statsJson = parseFile statsJsonFile
  let newUpdated = parseBiggestInt statsJson["updated"].str

  if newUpdated <= lastUpdated:
    return

  inc count

  for server in statsJson["servers"]:
    try:
      updateServer(server)
    except:
      discard

  if count == freq:
    count = 0
    for val in countTable.mvalues:
      val = 0

while true:
  let startTime = epochTime()

  updateAllServers()

  sleep(int(epochTime() - startTime + 1) * 1000) # every second
The final graphs can be seen on the DDNet Server Statistics page.
Nim monitor footprint:
| Part | CPU | Memory |
|---|---|---|
| Monitor (9 servers) | 0.03 % | 0.89 MB |
Alerts through Cron and Mail
Now we certainly have nice graphs, but automated alerts about suspicious events would be even better, for example:
- Network traffic over 2 MB/s for 4 min
- Memory and swap over 90% for 4 min
- CPU over 90% for 21 min
- Load over 10 for 21 min
- Server unreachable for 1 hour
To check these conditions a cron job is run regularly and thanks to a MAILTO entry a mail is sent when an alert has been triggered.
We can get out a single value from the database to standard output using PRINT:
rrdtool graph x -s-4min \
  DEF:v=ddnet.tw-net.rrd:network_rx:AVERAGE \
  VDEF:vm=v,AVERAGE \
  PRINT:vm:%lf
The alert program itself is written in Nim as well and merely gets a few values from the databases and checks if the limits are exceeded:
import common, osproc, os, json, strutils

proc get(file, value, time: string): float =
  let (output, errorCode) = execCmdEx(rrdtool & " graph x -s -" & time & " DEF:v=" & file & ":" & value & ":AVERAGE VDEF:vm=v,AVERAGE PRINT:vm:%lf")

  if errorCode != 0:
    raise newException(ValueError, "Error code " & $errorCode & " from rrdtool: " & output)

  result = output.splitLines[^2].parseFloat

if paramCount() != 1:
  echo "alert [1d|7d|49d]"
  quit 1

let statsJson = parseFile statsJsonFile
for server in statsJson["servers"]:
  let
    domain = server["type"].str
    name = server["name"].str
    fileNet = (rrdDir / domain) & "-net.rrd"
    fileCpu = (rrdDir / domain) & "-cpu.rrd"
    fileMem = (rrdDir / domain) & "-mem.rrd"

  template alert(s: string) = echo name, " ", s

  case paramStr(1)
  of "1d":
    if fileNet.get("network_rx", "4min") + fileNet.get("network_tx", "4min") > 2_000_000:
      alert "network traffic over 2 MB/s for 4 min"

    if fileMem.get("memory_used", "4min") + fileMem.get("swap_used", "4min") > 0.9 * (fileMem.get("memory_total", "4min") + fileMem.get("swap_total", "4min")):
      alert "memory and swap over 90% for 4 min"

  of "7d":
    if fileCpu.get("cpu", "21min") > 90.0:
      alert "CPU over 90% for 21 min"
    if fileCpu.get("load", "21min") > 10.0:
      alert "Load over 10 for 21 min"

  of "49d":
    let network_rx = fileNet.get("network_rx", "4410")
    if network_rx != network_rx: # NaN
      alert "unreachable for 1 hour"

  else:
    echo "unknown parameter ", paramStr(1)
    quit 1
Nim alert footprint:
| Part | Runtime | Memory |
|---|---|---|
| Alert (9 servers) | 0.25 s | 2.12 MB |
Conclusion
Live view of the last day of the DDNet.tw web server, also hosting this blog:
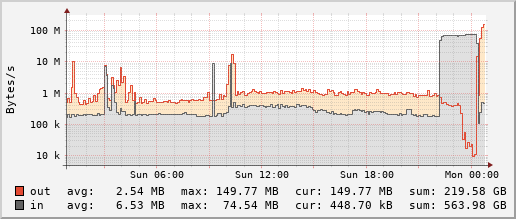

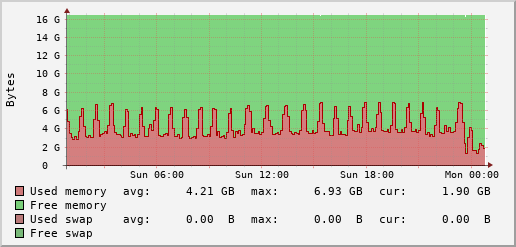
You can see the full graphs on the DDNet Server Statistics page. As usual you can find the entire source code in our git repository.
All in all the system runs on very little resources, puts out some nice graphs and alerts me automatically about defined problems.
| Part | Runtime | CPU | Memory |
|---|---|---|---|
| Client | 0.14 % | 3.70 MB | |
| Server (9 clients) | 0.58 % | 0.18 MB | |
| Create (9 servers) | 0.01 s | 1.74 MB | |
| Graph (9 servers) | 1.99 s | 2.82 MB | |
| Monitor (9 servers) | 0.03 % | 0.89 MB | |
| Alert (9 servers) | 0.25 s | 2.12 MB |